Yield Curve.
What is a yield curve & why it matters.

Let’s first understand the system we participate in.
The Debt/Bond/Credit market allows participants to issue new debt or buy and sell debt securities.
The bond market is enormous. According to the Securities Industry and Financial market association, the size of the U.S. bond market was $46 Trillion, more than double the U.S. economy in 2021.
Government bond market:
A government bond is a debt obligation issued by a national government to support government spending.
When issuing a bond, the government commits to pay periodic interest. To use a more professional wording, it’s called Coupon payment. The government also commits to repaying the face value (the loan) when the debt ends (matures).
For example, if you invest $1,000 into a 10-year government bond with a 5% annual yield, you get paid $50 on the $1,000 each year. At the maturity date, the government would give back the original $1,000.
What is yield, and how do we calculate it:
The price of the bond when it’s issued is called face value. To get to the “yield,” you need to divide the coupon payment by the face value or the bond price. For example, if you’re going to get paid $50 annually and the bond is selling for $1,000, your yield is 5%.
Coupon rate/Price = Yield
$50/$1000 = 5%
The inverse relation between price and yield:
Due to the powers of supply and demand, the price of the bond you’re willing to buy or sell might change. What would happen to the yield if the same bond from the previous example is now selling for $900? The yield would rise. Hence the inverse relations between the price and the yield.
Coupon rate/Price = Yield
$50/$900 = 5.5%.
What does the yield tell us?
All bonds carry default risk. The higher the yield, the higher the risk.
Let’s have an example from our lives if you were to lend $1,000 (Face value) to both of your friends for five years (maturity).
Friend A has no job and went bankrupt. (High risk)
Friend B has a career in finance and never missed a payment on his loans. (Low Risk).
On which one of these friends would you charge a higher interest? (Coupon payment).
You would have no heart if you said you would charge your friend A. I’m kidding; you got the risk management point if you did. But let’s say we will set the interest for both of them to $50 annually because you are good friends.
Now let’s say you opened a marketplace with many participants who can buy and sell your friends’ debt; you hand prospects about your friends explaining their financial backgrounds. People who don’t know your friends personally could start trading the above bonds.
Remember, we already set the coupon payment at $50, and the face value is $1,000.
Your friends must pay their debt holders $50 periodically and $1,000 when the loan ends.
What would some of the people do?
The participants in this marketplace will demand a higher rate of return on our friend A since he’s deemed riskier. The thing they can control is the Face value of the bond. A sell-off in the bond would lower the bond price, which will lead to higher yields. Once the yield is high enough, the same market participants sellers will now be okay with holding the bonds. These people are called bond vigilantes. They would sell bonds, thus increasing the yields.
The term of the bond and the risk:
The longer you’re giving away your money, the higher the yield you will demand. A lot can happen in five years, but more things can happen in ten, let alone thirty years.
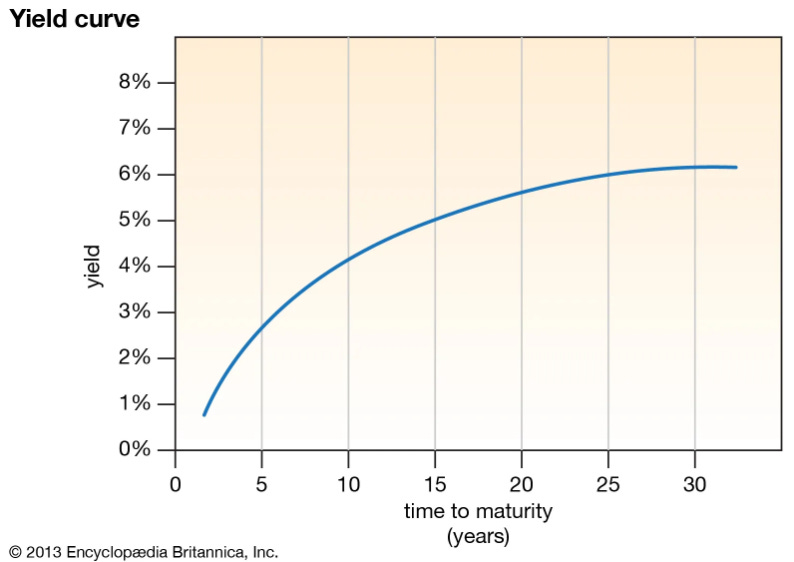
The yield curve:
The yield curve is a chart of current pricing on U.S. Treasury Debt Instruments by maturity.
The US Treasury currently issues debt in maturities of 1, 2, 3, and 6 months and 1, 2, 3, 5, 7, 10, 20, and 30 years.
Remember when we mentioned Friend A and Friend B?
The U.S would be Friend B, the one with the low risk. Also, remember when we talked about the maturity of the bonds? The longer we are giving away our money, the higher the yield.
Based on the above assumptions, we can assume that in typical times, yields on the 30 years debt will be higher than the 20 years. And the yield on 20 years debt will be higher than the ten years debt and so on.
If we were to draw the chart, it would look something like this:
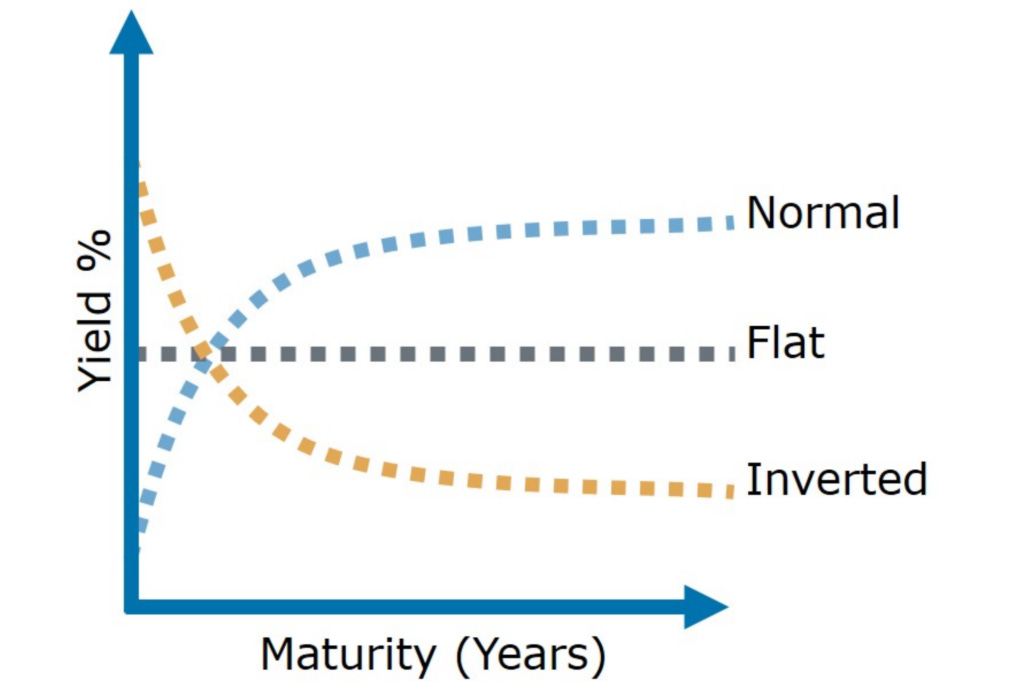
What causes the yield curve to invert?
Most straightforwardly, an inverted yield curve is caused by the yield of the short-term debt (left side of the chart) to rise while the yield of the long-term debt falls. Federal Reserve’s policy stance will help explain movements in the short end of the yield curve, which represents the short-term debt. Although the right side of the curve is harder to control, the yields on the longer-term debt can move fast.
The yield is affected by the bond’s price, and market participants can affect the bond price by buying or selling the bonds.
When market participants start buying the longer-term bonds and accepting the lower yield it is offering; they expect future interest rates to fall and want to secure the current rates. This comes from the expectation that the economy might be slowing down.
Before the yield curve inverts, it will flatten.
Here we can see how a yield curve would look like when it’s upward sloping, flat, and inverted:
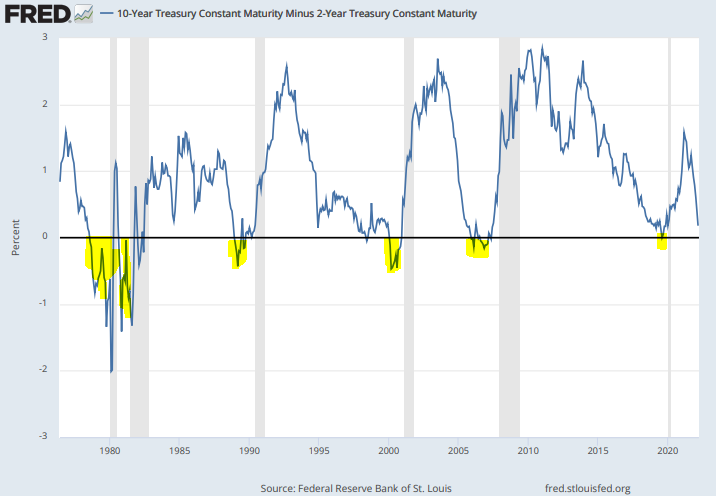
The yield spread:
Market participants mainly focus on the three-month - 10 years yield spread and the two-year - 10 years spread.
According to financial data, we might be heading into a recession whenever the three-month yield or the two-year yield grows higher than the ten-year yield (inversion).
Why is everyone freaking out about the yield curve?
An inverted yield curve has preceded every recession since the 1950s.
When people talk about the yield curve, they typically refer to the widely watched difference between two- and 10-year U.S. Treasury note yields.
But what about the three months and the ten years notes? Are we there now?
Not at all; looking at the yield spread between the two notes, we see that the spread is widening.
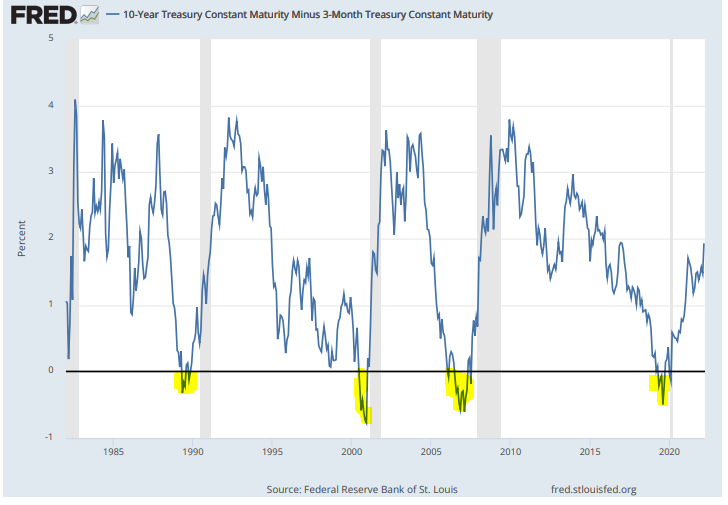
Overlaying both charts would show that both spreads inverted in recent history before entering a recession. It’s not happening this time.
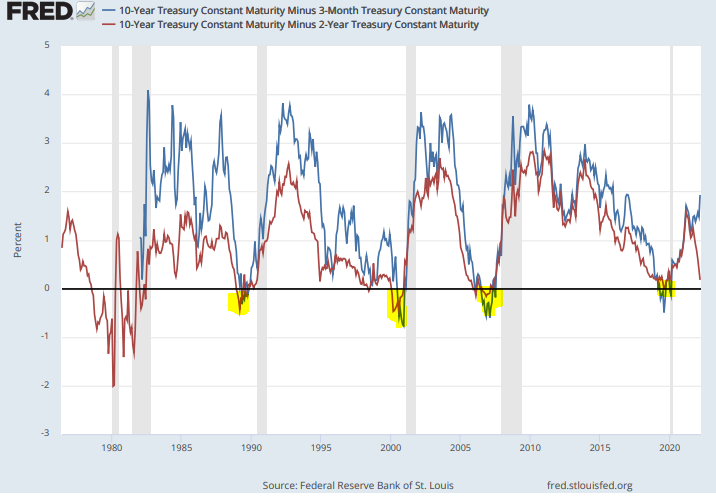
The New York Federal Reserve bank uses the difference between 10-year and 3-month Treasury rates as an indicator to calculate the probability of a recession in the United States twelve months ahead.
Are we entering a recession?
Before making such assumptions, there are more things to consider; one of them is consumer spending. Consumers are in perfect shape, yet, things might change quickly if inflation gets out of control.
Five factors have been primary drivers of recessions in the U.S. over the past one hundred years: mismatches between demand and supply in the industrial sector, oil price shocks, overly restrictive monetary policy, financial crises, and fiscal contractions in the wake of major military conflicts.